BrainState-ML: Deciphering Cognitive Assessment Performance and Brain Functional Organization from Task-fMRI Using Interpretable Machine Learning
An interpretable machine learning framework for decoding four distinct cognitive states from task-fMRI contrast maps using Schaefer 2018 cortical atlas parcellation ($100$ ROIs) and Yeo 7 functional network mapping.
fMRI Neuroimaging Brain Slicer & Statistical Maps
Interactive multi-plane slicing (Axial, Coronal, Sagittal) with Nilearn group statistical contrast maps.
fMRI Neuroimaging Brain Visualizer
Switch between 3D Cortical Surface Mesh and 2D/3D Anatomical Slice Explorer across MNI coordinates.
Group Activation Map (Yeo)
Nilearn fsaverage5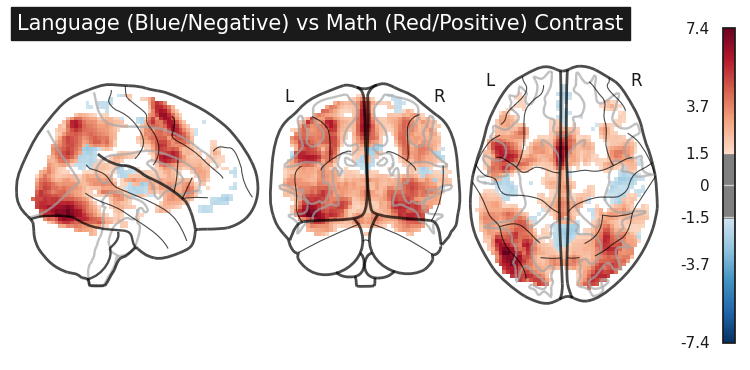
5-Stage Methodology Pipeline
End-to-end task-fMRI decoding and network-level interpretation framework
Brainomics Dataset
30 subjects $\times$ 4 task contrasts = 120 statistical activation maps (Math, Reading, Motor, Visual).
Schaefer-100 ROIs
Extract mean activations per parcel into 100D feature vector X ∈ ℝ120×100.
Stratified 5-Fold CV
Grid search hyperparameter tuning across Logistic Regression, Random Forest, Decision Tree, and KNN.
Model Benchmarking
Random Forest achieved highest accuracy ($85.83\%$), Logistic Regression selected for interpretability ($0.9656$ AUROC).
Yeo-7 Interpretation
Mapped coefficient weights (Mk,n) to canonical functional networks (Somatomotor, Control, Visual, etc.).
Classifier Performance Benchmark (%)
Comparing 4 supervised models under Stratified 5-Fold Cross-Validation
Yeo-7 Network Discriminative Importance (Mk,n)
Mean absolute coefficient weight mapped per functional network
Key Empirical Findings
Sensorimotor Separability
Motor Control and Visual Processing contrasts produced distinct, highly spatially localized activation signatures in somatomotor and occipital cortices, achieving near-perfect classification (1.000 AUROC).
Higher-Order Cognitive Overlap
Most classification errors occurred between Working Memory / Math and Language / Reading due to shared frontoparietal executive control and symbolic processing networks.
Functional Network Mapping
Frontoparietal Control and Dorsal Attention networks dominated Math decoding ($0.35$), while Default Mode Network contributed strongly to Language comprehension ($0.34$).